Type I Survivorship Curve
A Type I survivorship curve is a graphical representation used in ecology to track the survival of a population over time. Plotted on a semilogarithmic…
What is Type I survivorship curve?
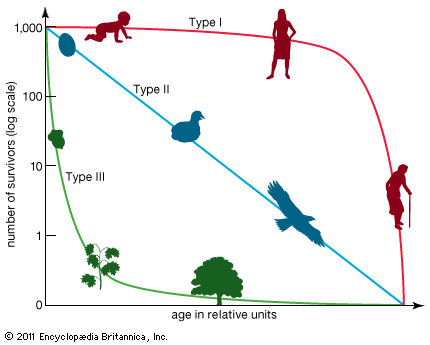
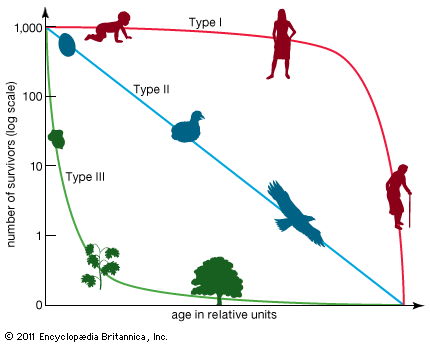
A Type I survivorship curve is a graphical representation used in ecology to track the survival of a population over time. Plotted on a semilogarithmic scale, this curve characterizes organisms that typically experience low mortality rates during their early and middle life stages, resulting in high survivorship. However, as these individuals reach the end of their natural life expectancies, the death rate increases dramatically.12
This pattern is common among K-selected species, such as human beings and large mammals like elephants, hippopotamuses, and gorillas. These species generally produce fewer offspring but invest significant time and energy into parental care, which contributes to high juvenile survival.1
What are K-selected species?
K-selected species are organisms whose populations typically remain stable at or near the carrying capacity (K) of their environment. This life-history strategy, defined by ecologists Robert MacArthur and Edward O. Wilson, contrasts with r-selected species, which prioritize maximum reproductive capacity.3
Key characteristics of K-selected species include:
- Reproduction: They produce relatively few offspring, but these individuals are typically larger at birth.3
- Development: They exhibit slow maturation, long gestation periods, and extended parental care.3
- Lifespan: They generally possess long life spans and often follow a Type I survivorship curve, characterized by low juvenile mortality.31
- Habitat: They tend to inhabit stable biological communities, such as climax forests.3
Common examples include birds, larger mammals—such as elephants, horses, and primates—and larger plants.3
How does a Type III survivorship curve differ from Type I?
A Type I survivorship curve and a Type III survivorship curve represent opposite ends of the spectrum regarding mortality patterns in ecology.25
- Type I Curve: Characteristic of K-selected species like humans and large mammals, this curve is relatively flat, indicating low juvenile mortality. Most individuals survive until they reach old age, at which point the death rate increases dramatically.25
- Type III Curve: Characteristic of many insects, fish, and shellfish, this curve is initially very steep, reflecting high mortality rates among the young. However, the curve flattens out for those individuals that successfully reach maturity, as they tend to survive for a longer period.25
While Type I species typically invest significant energy into parental care to ensure offspring survival, Type III species often produce many offspring with little to no parental investment, relying on high numbers to ensure the survival of the population.5
We could dive deeper into how Type II survivorship curves represent a constant mortality rate regardless of age.
What characterizes a Type II survivorship curve?
A Type II survivorship curve tracks organisms whose mortality remains relatively constant throughout their lives, regardless of age.52
When plotted on a semilogarithmic scale, this pattern appears as a straight line with a constant slope that decreases over time toward zero. Unlike Type I or Type III curves, which show age-specific spikes in death rates, the Type II curve indicates that an individual has an equal probability of dying at any point during its life expectancy.562
Organisms that exhibit this type of survivorship include certain lizards, perching birds, and rodents. It is important to note that many natural populations exhibit patterns that are more complex or fall between these three idealized models; for instance, some passerine birds experience higher mortality in their first year before settling into a more constant rate of death in later years.56
Sources
- Type I survivorship curve — Encyclopædia Britannica
- survivorship curve — Encyclopædia Britannica
- K-selected species — Encyclopædia Britannica
- kin selection — Encyclopædia Britannica
- Type II survivorship curve — Encyclopædia Britannica
- population ecology - Survivorship curves — Encyclopædia Britannica
Published on · 3 min read