Type II Survivorship Curve
A Type II survivorship curve is a graphical representation in ecology used to track the mortality of a population cohort over time. Unlike other models, this…
What is Type II survivorship curve?
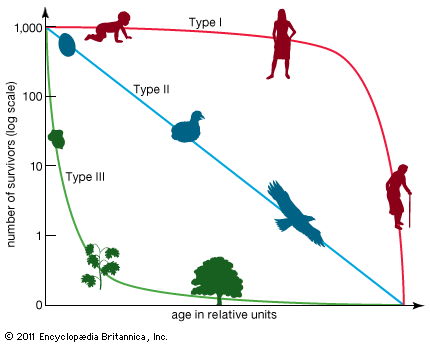
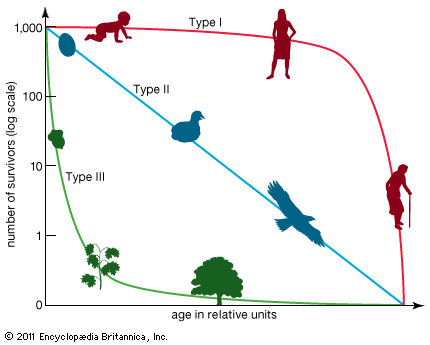
A Type II survivorship curve is a graphical representation in ecology used to track the mortality of a population cohort over time. Unlike other models, this curve depicts organisms that experience a relatively constant probability of dying at any age throughout their life expectancy.123
When plotted on a semilogarithmic scale, the Type II curve appears as a straight line with a constant slope that decreases toward zero as the cohort ages. This pattern is observed in various species, including certain lizards, rodents, and perching birds, though some of these populations may exhibit more complex patterns, such as higher mortality during their first year of life.12
This curve stands in contrast to the Type I survivorship curve, where mortality is low until old age, and the Type III survivorship curve, which is characterized by high juvenile mortality.32
What are the main differences between Type I and Type III survivorship curves?
The primary difference between Type I and Type III survivorship curves lies in the timing of mortality within a population’s life cycle.
Key Differences
- Mortality Patterns: Type I curves represent species with low juvenile mortality, where most individuals survive to reach old age before experiencing a sharp increase in death rates. Conversely, Type III curves represent species with extremely high mortality rates among the young, which then flatten out for the few individuals that reach maturity.423
- Reproductive Strategy: Type I organisms are typically K-selected species, producing fewer offspring but investing significant time and energy into their care. Type III organisms are often r-selected species, which produce large numbers of offspring but provide little to no parental care.43
- Examples: Humans, elephants, and gorillas are classic examples of Type I, while many insects, fishes, and shellfish follow the Type III pattern.423
How do K-selected and r-selected species influence these curves?
The life-history strategies of K-selected and r-selected species are fundamental drivers of the patterns observed in survivorship curves. These strategies dictate how species allocate energy toward reproduction and parental care, which directly influences juvenile and adult mortality rates.4
K-selected Species and Type I Curves
K-selected species typically inhabit stable environments and maintain populations near the carrying capacity of their habitat. Because they produce fewer offspring and invest significant time and energy into their development, these species exhibit a Type I survivorship curve. This curve is characterized by:534
- Low juvenile mortality: High levels of parental care ensure that most offspring survive the early stages of life.34
- Longevity: Individuals tend to live long lives, with the death rate only increasing significantly as they approach the limits of their natural life expectancy.34
r-selected Species and Type III Curves
In contrast, r-selected species are governed by their biotic potential, focusing on rapid reproduction and high offspring numbers. These species typically follow a Type III survivorship curve, which is defined by:54
- High juvenile mortality: Because these species provide little to no parental care, the vast majority of offspring die shortly after birth or hatching.46
- Survival to maturity: The curve is initially very steep, reflecting this high early mortality, but it flattens out for the few individuals that successfully reach maturity, as they then experience a higher probability of survival.4
Why do scientists use semilogarithmic scales to plot survivorship data?
Scientists use semilogarithmic scales to plot survivorship curves because they allow for a clearer representation of mortality patterns across different life stages and species. While arithmetic scales can make it difficult to visualize data when population numbers span several orders of magnitude, a semilogarithmic scale—where the y-axis is logarithmic and the x-axis is arithmetic—transforms these patterns into more interpretable shapes.1
Specifically, this scaling method is useful because:
- Constant Mortality: It reveals a constant probability of dying at any age as a straight line with a constant slope, which is the defining characteristic of a Type II survivorship curve.31
- Comparative Analysis: It provides a standardized way to compare the life histories of diverse species, from those with high juvenile mortality (Type III) to those with high survival rates until old age (Type I).14
By using this logarithmic transformation, ecologists can more easily identify and analyze the specific demographic trends within a cohort over time.1
Sources
- Type II survivorship curve — Encyclopædia Britannica
- survivorship curve — Encyclopædia Britannica
- population ecology - Survivorship curves — Encyclopædia Britannica
- Type I survivorship curve — Encyclopædia Britannica
- K-selected species — Encyclopædia Britannica
- Animal social behavior - Social interactions involving the costs and benefits of parental care — Encyclopædia Britannica
Published on · 3 min read