Why Does Greenland Look So Big on Some Maps?
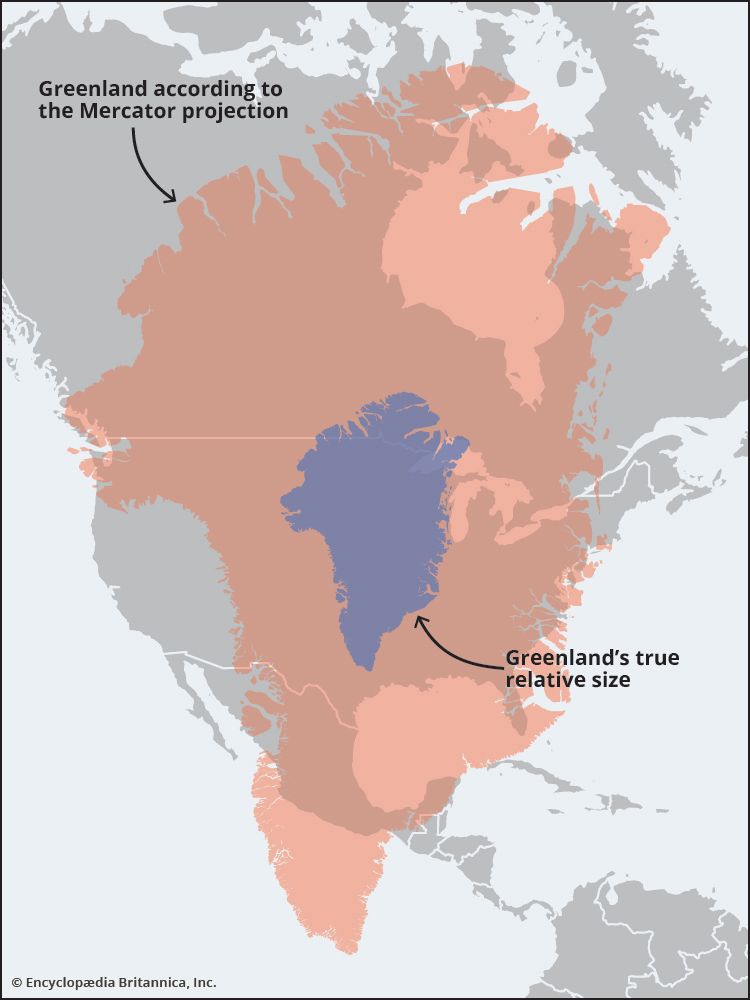
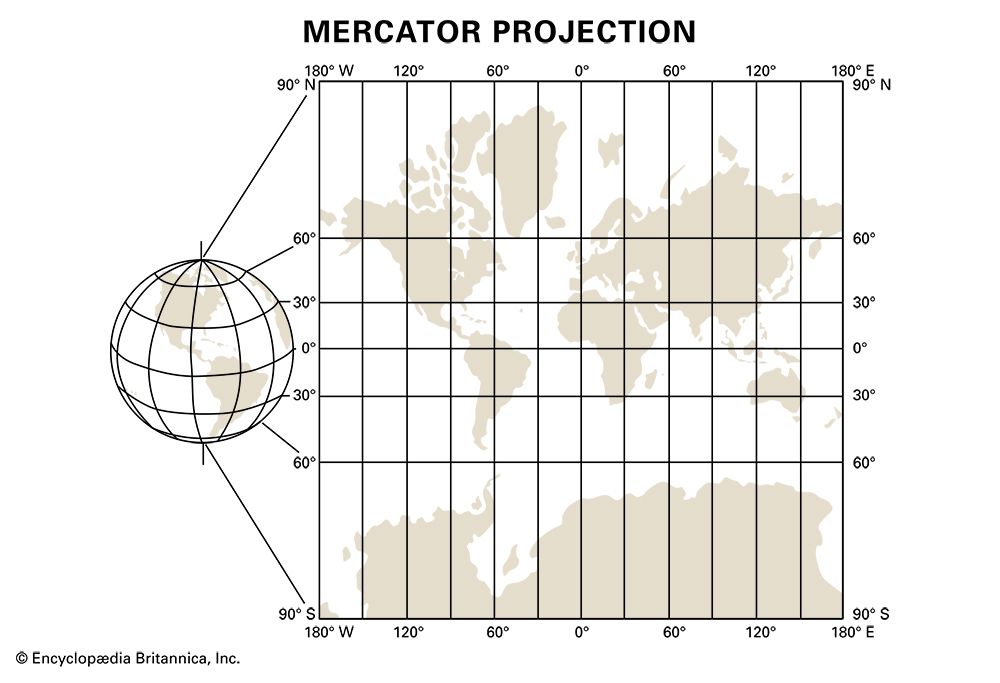
Greenland appears disproportionately large on many maps due to the Mercator projection, a cylindrical projection developed in 1569 by Gerardus Mercator.
Why Does Greenland Look So Big on Some Maps?
Greenland appears disproportionately large on many maps due to the Mercator projection, a cylindrical projection developed in 1569 by Gerardus Mercator.12
While this projection is highly valuable for navigation because it allows sailors to plot straight-line courses, it inherently distorts the size of landmasses. Because the map represents a spherical Earth on a flat surface, the scale increases as you move away from the Equator. Consequently, regions near the poles, such as Greenland, are significantly exaggerated in size.12
In reality, Greenland covers about 836,330 square miles—roughly the size of Saudi Arabia—yet it often appears comparable to the entire continent of Africa on Mercator-based world maps. Cartographers have developed alternatives, such as the Robinson projection and the Dymaxion Map, to better represent the true spatial relationships of the world’s landmasses.1
What is the Robinson projection?
The Robinson projection is a map projection developed in 1978 by the American geographer Arthur H. Robinson. It was designed as a compromise to address the significant size distortions found in the Mercator projection, particularly the exaggeration of landmasses near the poles.31
Key features of the Robinson projection include:
- Compromise Design: It is often referred to as an “orthophanic” or “right appearing” projection because it balances the distortion of size, shape, and distance to provide a more visually accurate representation of the world.1
- Pole Representation: Unlike projections that represent the poles as points, the Robinson projection displays the poles as lines.3
- Improved Proportions: It provides a more accurate portrayal of high-latitude landmasses and the ratio of water to land compared to cylindrical projections.3
While it is less effective than the Mercator projection for navigation, it is widely favored for general-purpose world maps because it better represents the true spatial relationships of the Earth’s continents.1
Why was the Mercator projection useful for sailors?
The Mercator projection became an essential tool for navigation because it allows sailors to plot a course as a straight line while maintaining a constant compass bearing.42
On the surface of the Earth, a path that maintains a constant angle relative to the meridians is known as a rhumb line. Because meridians converge at the poles, following a constant bearing on a globe actually results in a spiral path rather than a straight line. The Mercator projection solves this by representing meridians as equally spaced vertical lines and adjusting the spacing of the parallels of latitude. This mathematical transformation ensures that rhumb lines appear as straight lines on the chart.254
While this projection distorts the scale and size of landmasses—particularly those far from the Equator—navigators historically prioritized the ability to reliably maintain a constant direction over the accurate representation of distance, as it significantly reduced the risk of missing a destination.54
We could dive deeper into how other navigational tools, such as great circle routes, differ from rhumb lines.
How does the Dymaxion map work?
The Dymaxion map is a unique polyhedral projection developed by the American polymath R. Buckminster Fuller and architect Shoji Sadao. Unlike traditional cylindrical projections that attempt to flatten the spherical Earth into a single rectangle, the Dymaxion map works by projecting the world onto the surface of an icosahedron—a 20-sided geometric shape.1
The map functions by unfolding this icosahedron into a flat, two-dimensional net. This approach offers several distinct characteristics:
- Reduced Distortion: By breaking the surface into triangular facets, it significantly minimizes the size and shape distortions common in maps like the Mercator projection, effectively solving the “Greenland problem” where landmasses near the poles appear disproportionately large.1
- Non-Traditional Orientation: The map dispenses entirely with the standard north-south orientation, allowing the world to be viewed from various perspectives without a fixed “top” or “bottom.”1
- Spatial Integrity: It prioritizes the accurate representation of the relative size and spatial relationships of the world’s continents, providing a more realistic view of the Earth’s landmasses.1
Sources
- Why Does Greenland Look So Big on Some Maps? — Encyclopædia Britannica
- Mercator projection — Encyclopædia Britannica
- Robinson projection — Merriam-Webster
- navigation - The Mercator chart — Encyclopædia Britannica
- rhumb line — Encyclopædia Britannica
Published on · 3 min read